Solutions For Electric Utilities

Trusted program measurement and deeper customer engagement, in one platform

Electric utilities are adapting to a quickly changing world of distributed devices, advanced analytics, and increasing customer expectations. Enpira delivers data solutions your team can act on — and your stakeholders can trust.

Why Electric Utilities Choose Enpira

Built for both sides of the utility relationship

Electric utilities serve millions of customers across residential, commercial, and industrial segments — each with different rate structures, usage patterns, and expectations. Enpira gives you the analytical support you need to serve them all well.

A blue line-art icon of a desktop computer screen featuring interactive data visualizations, including a three-slice pie chart and a four-bar vertical graph.

Comprehensive Customer Intelligence

Enpira consolidates billing data, smart meter data, customer property information, and program participation history into a single platform — giving your team a complete, organized view of every location you serve.

A stylized blue icon representing a building with a protective shield and a checkmark, symbolizing verified measurement and security.

Best Practice Demand Side Analytics

From load control and behavioral programs to residential and commercial efficiency initiatives, Enpira quantifies energy and demand savings using industry accepted methodologies - with results rigorous enough for reporting.

A blue line-art icon showing two utility bills; the front bill features a dollar sign and a magnifying glass, symbolizing a detailed financial audit or review.

Purpose-Built Economic Studies

Enpira builds studies around your rate structures, customer base, and procurement terms — and turns scenarios around in days so your team can move with confidence.

A laptop and tablet displaying the Enpira software dashboard, showing high resolution Electric Grid Load Profile data and a map with customer information for electric utilities.
Customer Engagement

Your smart meter data knows your customers better than you might think

The most effective utility customer relationships are built on insight, not just billing. Enpira combines your smart meter data with property, demographic, and weather data so you can engage customers in ways that are personalized, relevant, and genuinely useful — strengthening loyalty while advancing your demand side management objectives.

A blue line-art icon featuring a computer screen with a bar chart, connected by lines to several circular nodes, representing data flow and system integration.

Customer Facility Profiles
Enpira consolidates all relevant information for customer energy analysis in one place: billing data, smart meter data, property, and demographic data.

A stylized blue smartphone icon with a clock showing 8:55 and a message bubble containing a lightning bolt, symbolizing real-time utility communication.

Personalized Emails
Enpira generates personalized outreach emails for your residential customers based on their actual usage patterns, home characteristics, and seasonal behavior.

A blue line-art icon depicting a cupped hand supporting three five-pointed stars with radiating lines, symbolizing premium service and managed care.

Key Account Support
Engage your Commercial and Industrial key accounts with insights about how they use energy and how they can lower cost for themselves and the utility.

A line of modern white and grey electric cars charging at a grid facility with blue decorative graphic elements, illustrating Enpira's grid and distributed device analytics.
Grid and Distributed Device Analytics

Turn your meter data into a window on your grid

Your smart meter network is one of the most valuable and underutilized assets in your infrastructure. Enpira puts that data to work — monitoring grid assets, evaluating the load impact of distributed energy devices, and identifying emerging customer behaviors before they show up as grid management challenges.

Blue line-art icon featuring a lightning bolt inside a downward-pointing arrow, symbolizing energy load reduction and demand response control.

Demand Response Event Evaluation
From smart devices to voltage conservation and behavioral notifications, Enpira assesses the effectiveness of your load control programs using industry accepted methodologies.

Blue line-art icon of two utility poles connected by power lines, representing electrical grid infrastructure.

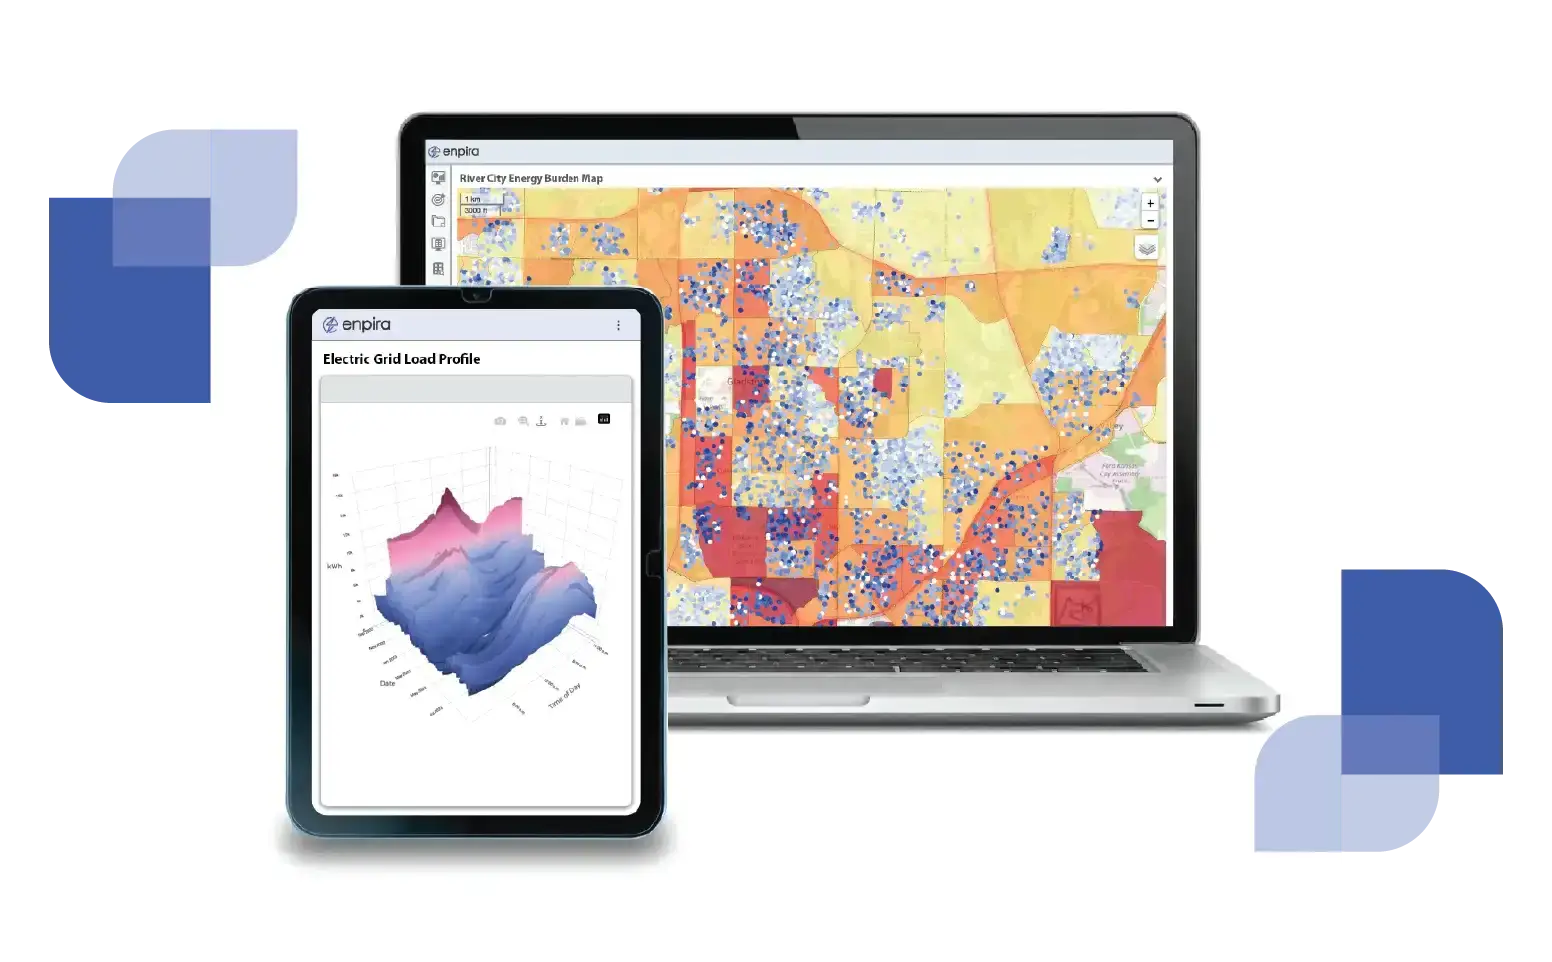
Feeder Line and Transformer Analysis
Totalize meter data by substation, feeder line, or transformer to unlock your interval data-driven grid and asset monitoring.

A blue line-art icon of a small car where the roofline transitions into an electric vehicle charging cable and plug.

Electric Vehicle Detection
Identify new electric vehicles in your customer base through unique charging signatures by power draw, duration, and time of day - and offer these customers EV charging rates.

A desktop monitor displaying the Enpira software dashboard, featuring a scatter plot graph and energy data analytics independent measurement and verification of energy efficiency projects.
Customer Program Support

Find the right customers for the right programs — and prove the results

Running an effective efficiency program means finding the right customers, targeting the highest-value opportunities, and holding contractors accountable for the savings they estimate. Enpira gives your program administrators analytical support — from candidate identification through independent measurement and verification of completed projects.

Blue line-art icon showing a house silhouette integrated with a bar graph, representing residential energy data and efficiency.

Energy Efficiency Program Support
Enpira estimates the value of home energy improvements for all customers so your program administrators can target the highest-value-add homes for recruitment.

Blue line-art icon of three stylized people figures grouped together with a magnifying glass held over them, representing customer segment analysis.

Energy Burden Analysis
Enpira combines customer energy costs with household income data to identify customers spending more than 6% of their income on energy — focusing your assistance on customers most in need.

A blue line-art icon featuring a document with a dollar sign and a security shield containing a checkmark in the foreground, representing verified bill auditing.

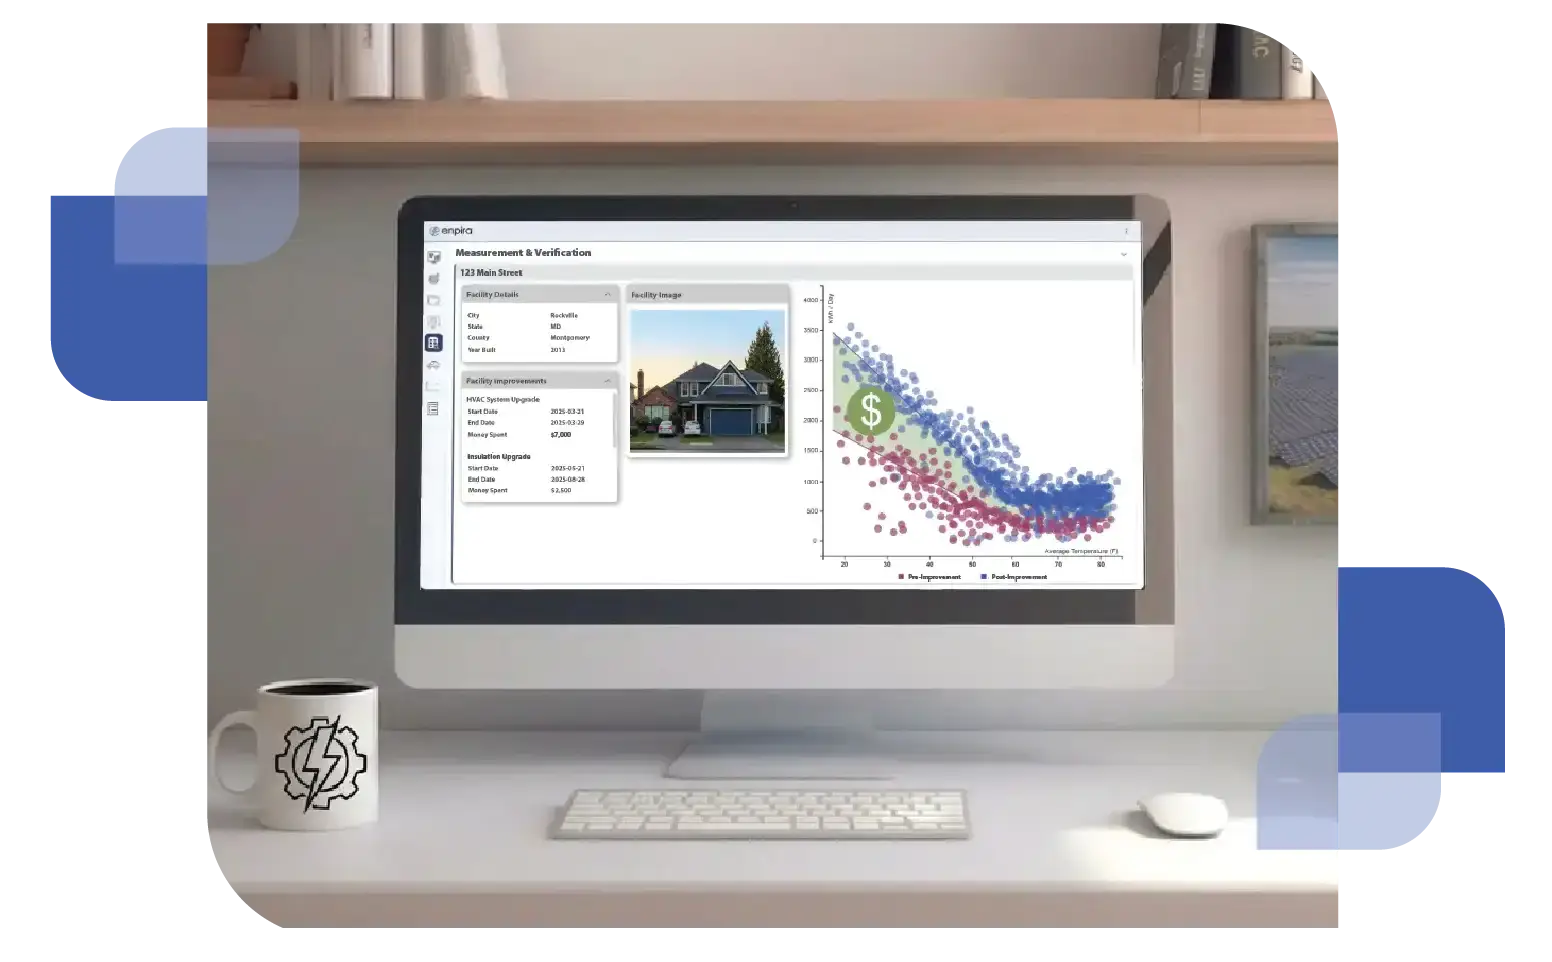
Energy Efficiency Program Assessment
Enpira acts as an independent measurement & verification provider to determine program performance and identify under-performing projects and contractors.
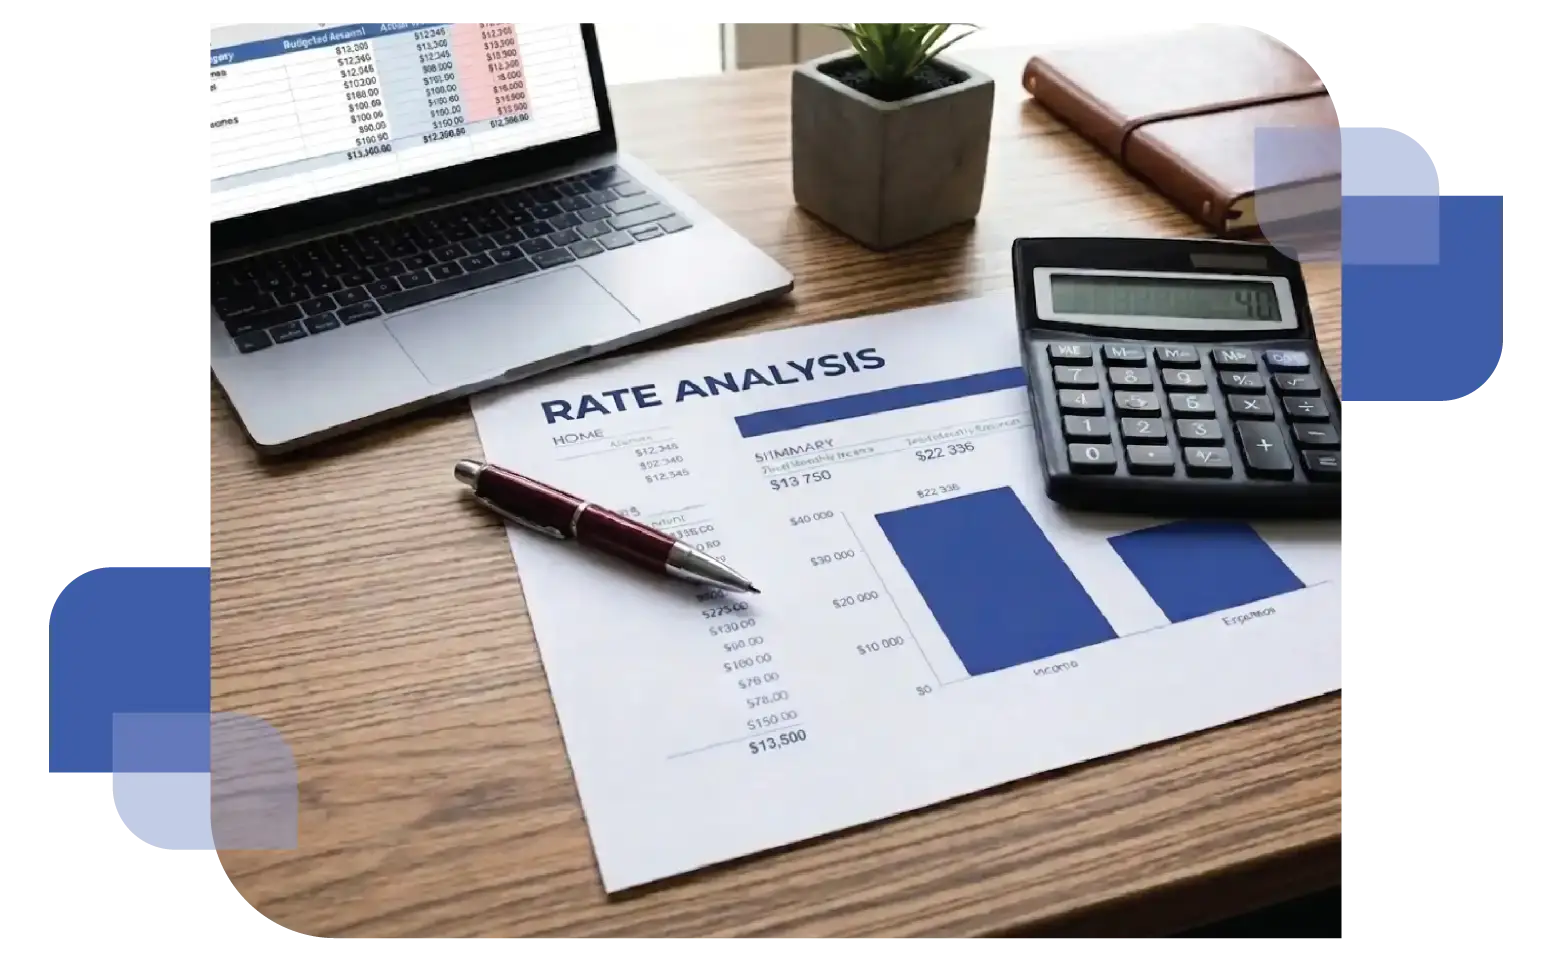
An office desk with a calculator, a pen, and printed documents showing "Rate Analysis" charts and graphs for utility cost modeling.
Rate Simulation and Cost-To-Serve

Model your economics in days, not months

Understanding the financial relationship between your rate structure and your customer base has historically required months of analysis. Enpira changes that — using your smart meter and billing data to model rate scenarios, calculate cost-to-serve at the customer level, and give your rate planning team the ability to iterate quickly and confidently.

A blue line-art icon of a balance scale, with one dollar sign in the left pan and another in the right, representing financial comparison or rate simulation.

Rate Simulation
Run rate simulations across your entire customer base to identify those who would most benefit from switching rates.

Blue line-art icon of a hand holding a coin with a dollar sign, representing the analysis of the cost to serve individual utility customers.

Cost-To-Serve Analysis
Combine rate simulation with your procurement contract terms to determine a cost-to-serve for each customer and identify unprofitable customers to address.

Blue line-art icon of a bar chart with a trend line and a dollar sign, representing financial data and budget forecasting.

Rate Planning
Model experimental rate structures across your entire customer base and see the projected impact on both customer bills and utility economics.

Ready to put your data to work for your customers and your grid?

See how Enpira works alongside your program and account teams to deliver measurable results and deepen the relationships that matter most to your utility.