Solutions For Local Governments

Responsible stewardship of public resources starts with accurate accounting

Cities, towns, and counties are stewards of public funds — and utilities represent one of the largest expenditures in any municipal budget. Enpira works alongside local government administrators, finance officers, and facilities staff to bring clarity and control to utility spending.

Why Local Governments Choose Enpira

Built for the complexity of public sector energy management

Local governments manage diverse portfolios — town halls, public safety facilities, libraries, community centers, parks, water and wastewater infrastructure, and more. Enpira gives you the visibility and the expert support to manage your utilities like a pro and streamline accurate reporting.

A blue line-art icon of a desktop computer screen featuring interactive data visualizations, including a three-slice pie chart and a four-bar vertical graph.

Every Facility, One Platform

All utility data across your entire municipal portfolio — electricity, gas, water, solar, and fleet fuel — aggregated, validated, and organized.

A blue line-art icon of a triangle with rounded corners containing a large exclamation mark, representing an alert or notification.

Identify Anomalies & Waste

Automated alerts flag energy anomalies, potential water leaks, and zombie accounts — with our team available to help you understand and act.

A blue icon showing two overlapping document sheets with horizontal lines, paired with a lightning bolt in the upper left corner and a gear in the bottom right corner to represent customizable report settings.

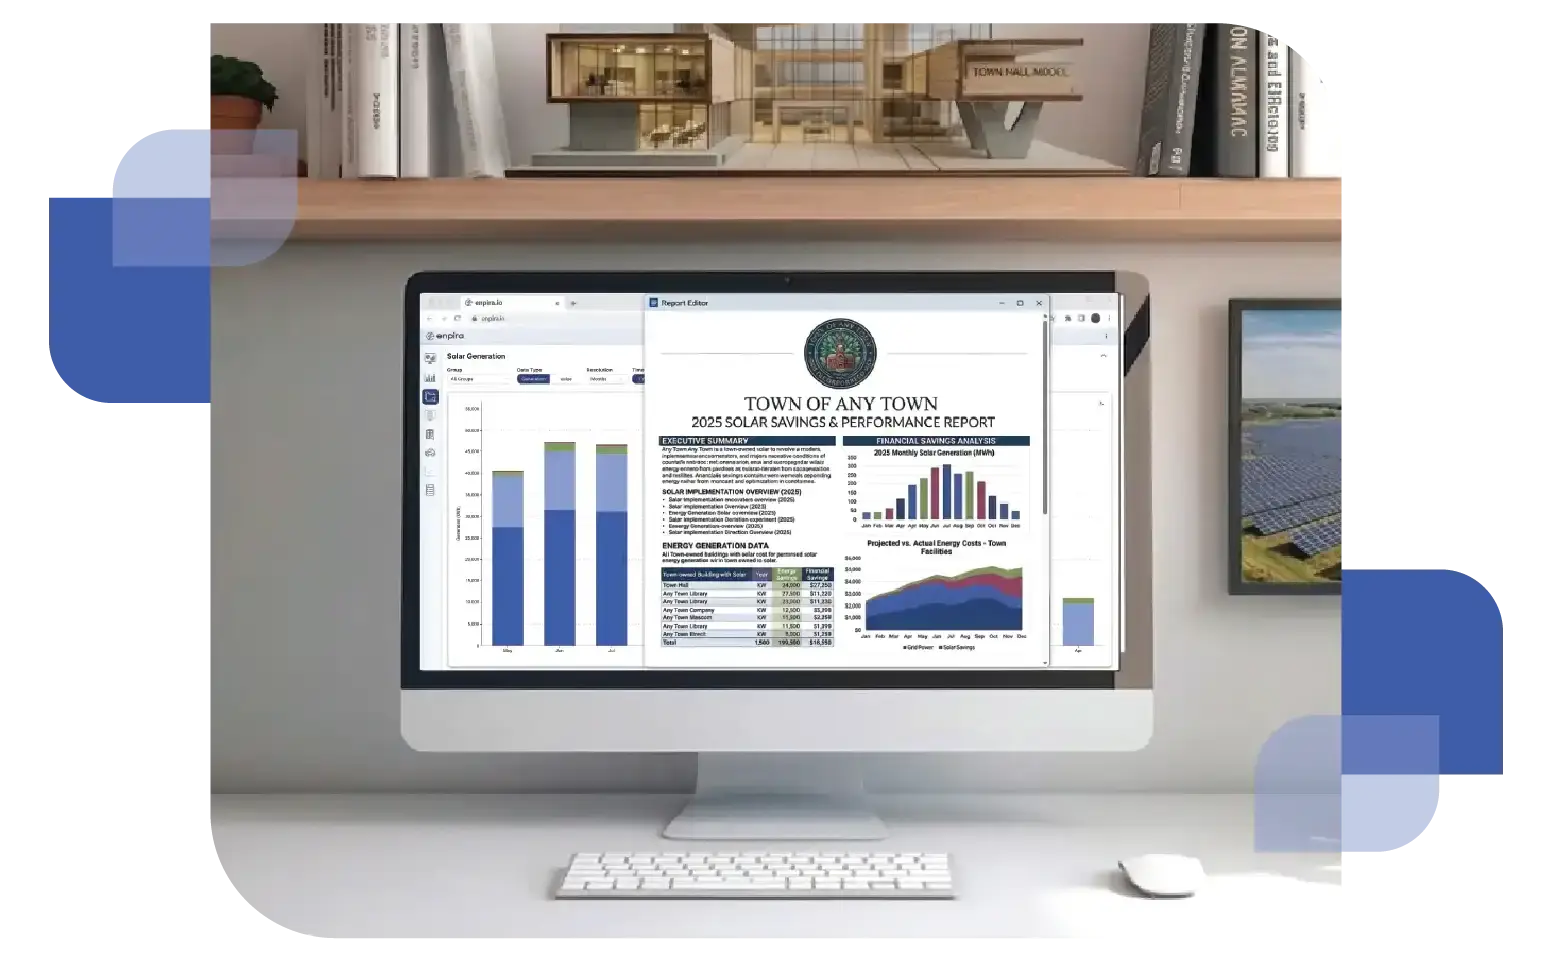
Council Reports Ready On Time

We prepare biannual utility reports proactively — and assist with custom reporting as requested. With up-to-date data, everything is ready to go.

Screenshot of the Enpira energy intelligence dashboard displayed on a laptop and tablet, showing various data visualizations including bar charts, pie charts, and utility usage metrics for municipal facility portfolios.

Portfolio Management & Benchmarking

Prioritize where your facilities investment will go furthest

Local governments need to direct limited resources where they will have the greatest impact. Enpira benchmarks every facility in your portfolio so you can focus resources on high-priority projects.

A blue line-art icon featuring a computer screen with a bar chart, connected by lines to several circular nodes, representing data flow and system integration.

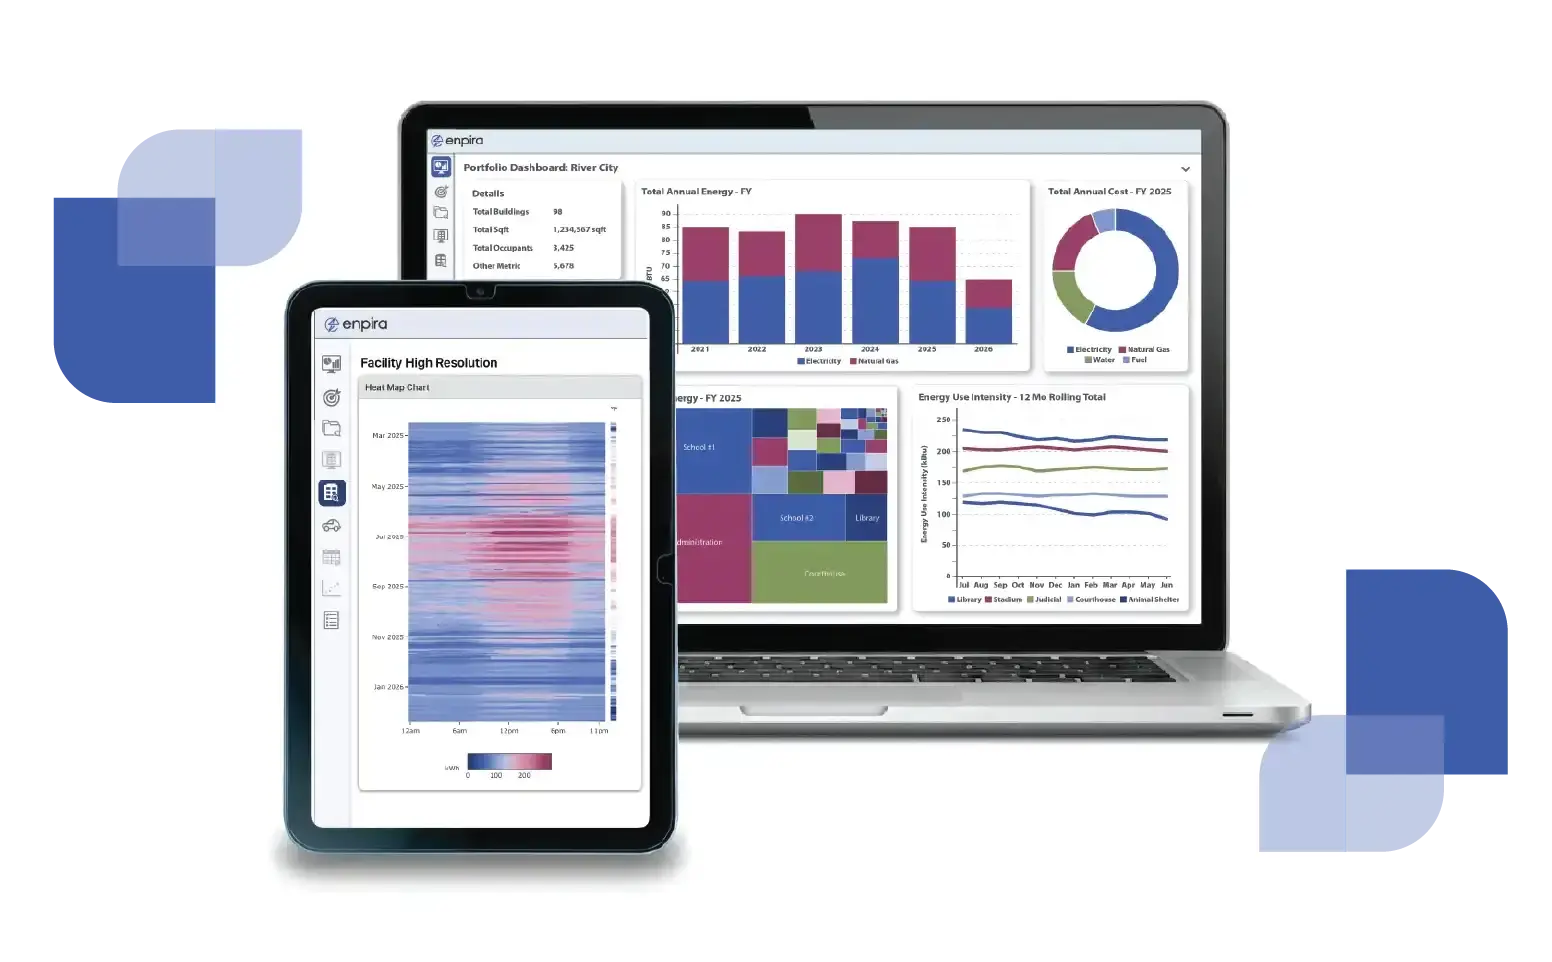
Multi-Commodity Tracking
Electricity, natural gas, water, and fleet fuel - all tracked in one platform, giving staff an organized view of municipal utility expenditures.

A blue line-art icon featuring a horizontal bar graph on the left and a simplified building on the right, representing Energy Use Intensity (EUI) data.

Facility Benchmarking Across Your Portfolio
Compare energy use intensity across municipal facilities by type, size, and age to identify underperforming assets for operational improvements and capital projects.

The blue and white ENERGY STAR logo, featuring the word "energy" in script and a trailing star icon above a blue bar with the words "ENERGY STAR" in block letters.

ENERGY STAR® Integration
Enpira connects directly with ENERGY STAR Portfolio Manager to automatically update Energy Star Scores and performance metrics across your portfolio.

A professional desk setup featuring a calculator, a monthly budget report, and a laptop displaying energy analytics, representing transparent and predictable utility pricing.

Budget Management & Fiscal Accountability

Protect the public budget from utility overspend

Enpira monitors your utility costs, audits for issues, and gives your Finance Department the cost visibility to plan accurately, respond quickly, and demonstrate fiscal responsibility to the public.

A blue line-art icon featuring four vertical bars of varying heights next to a circular coin symbol with a dollar sign, representing financial data and energy costs.

Cost Tracking by Department and Facility
Break down utility spending by department, cost center, or facility to support budget development, cost allocation, and variance reporting.

A blue line-art icon featuring a document with a dollar sign and a security shield containing a checkmark in the foreground, representing verified bill auditing.

Bill Auditing & Rate Validation
Utility bills are cross-checked against actual meter readings to catch billing errors, duplicate charges, and rate switch opportunities that lower costs.

Blue line-art icon of a bar chart with a trend line and a dollar sign, representing financial data and budget forecasting.

Budget Forecasting Support
Utilize Enpira's budgeting module to create projections and forecasts for any facility or department - give your finance team the foundation for accurate utility budget creation.

Desktop monitor displaying the Enpira energy intelligence dashboard with bar charts and data visualizations and a second window with a solar valuation report, all set on a professional office desk with a notebook and pen.

Capital Projects Savings Verification

Understand the value of your energy investments

Enpira provides local governments with the tools to measure and communicate the real impact of energy investments, making it easier to justify budget and secure funding for future projects.

A blue icon showing two overlapping document sheets with horizontal lines, paired with a lightning bolt in the upper left corner and a gear in the bottom right corner to represent customizable report settings.

Project Impact Determination
Use industry-standard weather-normalized savings measurement & verification to quantify savings from large capital improvements and secure utility rebates.

A blue line-art icon featuring a sun and a slanted solar panel, with a circular dollar sign symbol in the foreground to represent financial valuation.

Solar Valuation
Behind-the-meter solar affects utility bills in many ways. Enpira determines the true value of solar generation by comparing against solar-less scenarios.

A blue line-art icon of a piggy bank featuring a large dollar sign on its side, symbolizing financial savings and cost reduction.

Revolving Fund Accounting
Reinvestment funds enable savings from clean energy projects to be allocated to new projects. Enpira assesses the true value of your clean energy initiatives for accurate fund reporting.

Overhead shot of a workspace with printed sustainability reports, a smartphone, and a tablet showing a dashboard with the text "ESG" and leaf icons, representing environmental data management.

Sustainability Commitments & Climate Action

Measure your progress on climate commitments

Enpira makes it straightforward to track progress against sustainability and clean energy objectives and credibly report on progress, year after year.

Two overlapping document sheets featuring a leaf icon and horizontal text lines. A small gear is positioned at the bottom right to represent sustainability tracking settings.

Emissions & Clean Energy Targets
From comprehensive Scope 1 and 2 emissions calculations to clean energy transition - Enpira tracks all progress for you, using industry accepted best practices.

A blue line-art icon of a desktop computer screen featuring a carbon dioxide (CO2) cloud symbol, representing an emissions monitoring dashboard.

Climate Action Plan Tracking
Visualize your municipality's progress against multi-year climate action plans and sustainability goals - with clear, intuitive charts and reports.

A blue line-art security shield containing a bold white checkmark, representing verification and industry compliance.

Compliance & Disclosure Readiness
For municipalities subject to state benchmarking mandates, regional climate compacts, or federal reporting requirements, Enpira is your one-click solution.

Let's help your government lead by example

See how Enpira becomes a working partner to your municipality — managing the complexity of energy and utility data so your team can focus on serving your community.